Monday, October 31, 2016

Gearing up for Tableau Conference and getting ready to meet our customers


The Tableau Conference will be held next week in Austin, Texas.  First, yay Texas!  Second, this should be a great chance to meet our customers.  I have long advocated that everyone involved in the software industry should spend time talking with users of our software.  I started in tech support way back in the Windows 95 days and the lessons I learned there have been incredibly useful over the years.

For instance, it is easy to dismiss some unusual behavior in software by saying, "Well, that is an extremely rare case and the people that see that will understand what is happening." I heard this comment once about users that were trying to use a utility that claimed to compress your memory on Windows 95 and cause your computer to run faster.  This was not the case.  The company that made this utility claimed Win95 compatibility but the application simply did not work.  It crashed on boot and caused an ugly error when Windows started.  Many users that bought it did not know what to do and called Windows technical support instead (at which point we showed them how to disable the utility and contact the company that wrote it for support).  The lesson I learned there is that many users are savvy enough to know they want a faster machine and tend to believe companies that say they can deliver.  If they have problems, though, they get stuck and cannot fix the errors.  I liken this to cars - we want high mileage cars, but if a gizmo we buy does not work right, many of us have to turn to a mechanic for help.

And that is the lesson I learned, or re-learned: an ounce of prevention is worth a pound of cure.  If we can simplify the design so that potential errors are minimized, fewer people will have to contact support (or take their car to a mechanic, if you are following that analogy) for help.  And that benefits everyone.

I use that mentality early in the planning stages for features.  If we can push to simplify the design, or minimize the number of buttons to click, or eliminate even one dialog, the feature will be more resilient to errors created by clicking the wrong button or dismissing a dialog to early  or even something like another application stealing focus while a dialog is open.  
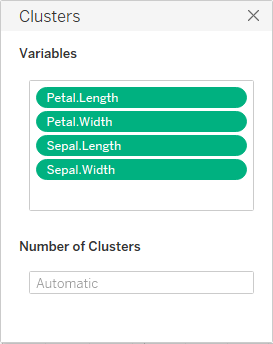
Feel free to let me know what you think of the Tableau interface for creating clusters, and I hope to see you next week at TC.  I will be in the logo wear booth for most of my time, so we should have plenty of time to talk!

Questions, comments, concerns and criticisms always welcome,
John

Monday, October 24, 2016

Automation fixes and generating test data


My automation changes are checked in and working fine, but I am putting this on hold right now as our team is working on a tool to generate test data for the future.

What we need is a tool to create CSV files with good test data, and the most obvious first step is to define "good" and "test" as they apply to data.  Let's talk about forecasting first.  We need time based data in order to test forecast.  There are a few statistical methods we could use for generating the data and I want to cover 2 of them here.

First is simply random.  Create a tool to generate random times  and some random value to go with it.  Think something like:
Time
Value
Jan 1, 2016, 12:02:53 AM
-126.3
July 8, 88, 2:19:21 PM
.000062

And so on.  This creates data sets that have little real world meaning (88 AD?  .00062?) but might be good test cases.  I like the way the Value column can have any number at any scale - that can really push an algorithm to its limits.  Think going from an atomic scale for length to a galactic scale for length - the precision of the algorithm will get stretched past a poorly designed breaking point for sure, and probably to the limit of a well designed breaking point.  And one of the roles of test is to verify that the breaking point (well covered in my first few posts on this blog), when hit, is handled gracefully.  Oh, and we document this as well.

The time column is a little more cumbersome.  Going back past 1582 gets dicey and right now Tableau only supports Gregorian calendars.  Also, date formats can lead to their own unique set of test cases that an application has to handle and most applications have a whole team to handle this area.  Notice also that I did not include time zones - that facet alone has contributed to the end of application development in some cases.

We might be tempted to have a rule about the lowest and highest values we have for the date/time of the Time column, but we need to test for extreme values as well.  But having a "bogus" value,  for instance, a year of 12,322 AD, would give us a good starting point for working on a potential code fix compared to documenting these extreme values.  Random cases can be good tests, but can also be noisy and point out the same known limitations over and over again.  In some cases, we want to avoid that and focus on more realistic data so that we can validate the code works correctly in non-extreme cases.

A second method for the time series that would help here would be to follow a time based generating process like Poisson .  Basically, this can be used to generate sample data for events that are based on the length of time between events, such as customers coming into a store.
Time
Number of Customers
10:00AM
5
10:10
7
10:20
11
10:30
24
10:40
16


Etc… 

So our tool will have to fulfill both these needs as well as any others we may discover as we move forward.  Once we have a good starting set of needs, we can start designing the tool.

Questions, comments, concerns and criticisms always welcome,
John


Monday, October 17, 2016

Adding to the order tests - making the edits a parameter


This week I have a new test checked in - it simply deletes pills from the cluster dialog and validates that the particular piece of data I removed is no longer used by the k means algorithm.  It checks that the number of clusters is the same after the removal.

And on that point I am very glad we have a deterministic algorithm.  When I wrote a kmeans classifier for an online class, we randomly determined starting points, and that led to the possibility of differing results when the code finished running.  Deterministic behavior makes validation much easier, and the user experience is also easier to understand.

So I added a test to delete a pill.  Not much to it, but now I and add, remove and reorder each pill in the list.  From here, I can use this as a parameter for other tests.  I can write a test to validate the clusters are computed correctly when a data source is refreshed, then combine that test with the "parameterized pill order" tests I have already written.  This gets me integration testing - testing how two or more features interact with each other.  That is often hard, and there can be holes in coverage.  You see this with a lot of reported bugs - "When I play an ogg vobis file in my firefox addin while Flash is loading on a separate tab…"  Those tests can get very involved and each setting like the music player, firefox tabs, flash loading and so on can have many different permutations to test.

The lesson here is to start small.  Find one parameter that can be automated and automate it.  Then use it to tie into other parameters.  That is the goal here and I will keep you updated.

Questions, comments, concerns and criticisms always welcome,
John

Monday, October 10, 2016

More automation


Last week I left off with a test that mimics the user action of re-ordering the criteria you used to create clusters.  The clusters themselves should not change when this happens, and the test verifies that they do not change.  I got that failure fixed and it passed 10 times when I ran my test locally.

Why 10 times?  I have learned that any test which manipulates the UI can be flaky.  Although my test avoids the UI here as much as I can, it still has elements drawn on screen and might have intermittent delays while the OS draws something, or some random window pops up and steals focus, etc…  So I run my test many times in an attempt to root out sources of instability like these.

I would love to do more than 10 tests but the challenge becomes the time involved in running one of these end to end scenarios.  There is a lot of work for the computer to do to run this test.  The test framework has to be started (I'm assuming everything is installed already, but that is not always the case), Tableau has to be started, a workbook loaded, etc…  Then once done, cleanup needs to run, the OS needs to verify Tableau has actually exited, all logs monitored for failures and so on.  It's not unusual for tests like this to take several minutes and for sake of argument, let's call it 10 minutes.

Running my test 10 times on my local machine means 100 minutes of running - just over an hour and a half.  That is a lot of time.  Running 100 times would mean almost 17 hours of running.  This is actually doable - just kick off the 100x run before leaving to go home and it should be done the next morning. 

Running more than that would be ideal.  When I say these tests can be flaky, a 0.1% failure rate is what I am thinking.  In theory, a 1000x run would catch this.  But that now takes almost a week of run time.  There are some things we can do to help out here like run in virtual machines and such, but there is also a point of diminishing returns.

Plus, consider the random window popping open that steals focus and can cause my test to fail.  This doesn't have anything to do with clsutering - that works fine, and my test can verify that.  This is a broader problem that affects all tests .There are a couple of things we can do about that which I will cover next.

Questions, comments, concerns and criticisms always welcome,
John

Monday, October 3, 2016

Working on automation


Time for some practical applications of testing.  We have many different types of tests that we run on each build
 of Tableau.  These range from the "industry standard" unit tests, to integration tests, performance tests, end to
end scenario tests and many more in between.

This week I am working on end to end tests for our clustering algorithm.  I have a basic set of tests already done 
and want to extend that to check for regressions in the future.  We have a framework here built in Python that 
we use to either drive the UI (only if absolutely needed) to invoke actions direction in Tableau.  I'm using that to
add tests to manipulate the pills in the Edit Cluster dialog:


In case it is not obvious, I am using the iris data set.  It is a pretty basic set of flower data that we used to test 
kmeans as we worked on implementing the algorithm.  You can get it here.  I'm actually only using a subset of it 
since I really want to focus only on the test cases for this dialog and not so much on the underlying algorithm. 
don't need the whole set - just enough flowers that I detect a difference in the final output once I manipulate 
the pills in the dialog.

Some basic test cases for the dialog include:
  1. Deleting a pill from the list
  2. Adding a pill to the list
  3. Reordering the list
  4. Duplicating a pill in the list (sort of like #2 but is treated separately)
  5. Replacing a pill on the list (you can drop a pill on top of an existing pill to replace it.  
                       ( More on this case later).

I'll leave the number of clusters alone.  That is better covered by unit tests.

I'll let you know how it goes.  I should be done within a day or so, other interrupting work notwithstanding.

Questions, comments, concerns and criticisms always welcome,
John