It's been a different type of week here at Tableau. Between getting Monday off for Christmas and now Friday we will be out while we move buildings, there have only been three days to get work done.
So here is a just a short list of things I have done as a tester this week:
1. Posted LOTS of small code changes for review. As part of an efficiency effort, I am removing bits and pieces of dead code that are left around in the codebase. It is not an especially difficult task, but will help with maintainability over time. The most challenging aspect of this is not the code changes - it is finding the right set of folks to review the change I am trying to make. In some cases, this code has been around for many years, and digging through the history of the repository in those cases can be time consuming. I want to find the original people who checked in the code to validate my removal and easily more than half my time is spent on this one task.
2. I have managed to do some testing as well. The most frustrating part of this blog is that I seldom can mention what features I am testing since they are in development. I don't want to mention new features until they are shiping - I certainly don't want to imply we have a feature that appears to be ready to go only to find out there is some core problem with it. That creates confusion (at best) all around. But I managed to automate a test that checks for rounding errors and got that running as well as completing some manual testing tasks.
3. We are moving buildings this weekend, so I have spent some time packing my stuff. We also have some common areas, like a library, that I helped with as well. The movers will be in later today and we will be out while they are moving our gear around. The frustrating part is that our machines will be powered down. I won't be able to log in remotely to my machine to keep any of the processes flowing, but hey, I'll take the time off and enjoy myself!
So that's it for the short week here at Tableau. Happy New Year everyone!
Questions, comments, concerns and criticisms always welcome,
John
Thursday, December 29, 2016
Monday, December 19, 2016
Well, that saved some time
After getting our
unit tests assigned to the correct team, I took a few days off so no post last week. When I returned, I found a defect assigned to me saying
that a unit test was failing. In this
case, the test was related to filling in missing values from a column of data that
the user is trying to display in a visualization. Now, to be fair, there are many different
ways to try to infer what the missing data should be and there is a larger
question of whether you should impute a missing value at all. But the purpose of this test was to validate
that in a range of numbers with a missing value that if we want to use the
average of all the values to fill in a missing value, we would compute the average
correctly and actually add it to the column of missing data.
This is not an
especially difficult test and the code that it exercises is not all that
challenging either. If you ever take a
class in data science this is typically an exercise that you will be asked to
complete early in the class cycle. IIRC,
this was near the end of my first "semester" of this
online program from Johns Hopkins. (This
was a good class, by the way). Anyway, I
looked at the test and realized this was not my area - a partner team owns that
codepath now. I simply assigned it over
to them to investigate the source of the error and moved on to my next task.
My next task is
simply TFS - Team Foundation Server - cleanup.
I am our team's scrum master, so one of my duties is to stay on top of
incoming defects and help keep our sprint schedule on track. This doesn't take all that much time, maybe a
few hours per week, but being timely makes it much easier than letting the
database start to build up. So I devote
a small amount of time each day into scrubbing through it. After that, I will start digging into our
manual test cases to see if automating any of them would be the next best step
for me to take.
Questions, comments,
concerns and criticisms always welcome,
John
Monday, December 5, 2016
Unit and integration tests
I've been working
to assign ownership to the correct team for "unit tests"
recently. While changing the team name
that owns each test is straightforward in most cases, in some I had to step
into the tests to determine exactly what was being validated. This is a great way for me to learn the code,
by the way.
In any case, I soon
discovered that some of the tests I had been thinking about as unit tests are
actually integration tests. The
difference between the two is what I want to mention today.
A unit test is the
simples form of automated testing that we write. In a simple case, suppose I am writing a
calculator application and want to multiply two whole numbers. I could write a function that looks something
like this:
int multiply(int
first, int second)
{
int
result = 0;
for
(int i=0;i<first;i++)
{
result
= result + second;
}
return
result;
}
Now when I write a
unit test, I can pass in 8 and 4 and validate I get 32 as a result and also 0
and 2 to validate I get 0. Not much to
this but that is the point of a unit test - it tests just one function. If it fails, I know the exact one function
that now needs to be investigated.
Then suppose I add a
power function to the calculator.
Raising a number to a power is just multiplying the number by itself as
many times as I want the power t be, so my function to this might be:
int power(number,
power)
{
If(power<0)
return
ERROR_CODE;
int
result ;
for
(int i=0;i<power;i++)
{
result
= multiply(result, 1);
}
return
result;
}
I just call my
multiply command as part of my power command.
Reusing code is always a goal.
But now when I test
my power function, I have a challenge if the test fails. A failure might be in the part of the code
that is unique to my power function, or it could also be in the multiply
command. There could also exist a case
in which both tests are failing for different reasons. So instead of quickly finding the one bit of
ode I need to investigate, I now have 2 places to look and three investigations
to complete.
Looking more at the
calculator, if I added a "Compute compounded interest function" I
would need to use the power function and the multiply function and possibly a
few others as well. Now if a test fails
I might have dozens of locations to investigate.
On the positive
side, I might also discover a flaw in my code that only shows when one function
calls another. This type of
functionality is referred to as an integration
test and is absolutely critical to shipping software. Read about the most famous example of not
covering this here:
a Mars satellite was lost because Lockheed Martin tested all their code with
miles and everyone else tested all their code with kilometers. Very loosely speaking, the Lockheed code told
the spacecraft it was "1,000,000" from earth it meant one million
miles. When the satellite heard
"1,000,000" it assumed kilometers and that was the root of the loss
of the satellite. Integration tests
should have been use to catch this type of error.
Eagle eyed readers
will point out that my power function is useless without the multiply
function. How can I isolate my unit
tests to use only the code in that function instead of needing the multiply
command as well? I'll cover that next
time up.
Questions, comments,
concerns and criticisms always welcome,
John
Monday, November 28, 2016
Cleaning up ownership of some legacy tests
The Statistics team
used to be a combined team here at Tableau and was called Statistics and
Calculations. Before I started, there
was a small change made to make Statistics its own standalone team. All has been good since with one small
problem - all of the tests the combined team owned are labelled as being owned
by "Statistics and Calculations.
When a test fails, the person that notices usually just assigns the test
to Statistics (since our name comes first in that string, I guess) even if the
functionality being tested is not owned by our team.
An example of a
feature we own is Clustering. We wrote
that and own all the tests for it. An
example of a feature we do not own now that we are a standalone team would be
table calculations.
Anyway, we have
hundreds of tests that need to be retagged.
I decided to take on this work in order to properly tag ownership of the
tests. This way, if a test fails, it can
be properly routed to the best owner immediately. The first challenge is just getting a list of
all the files that I need to edit. The
lowly DOS command (DOS? Isn't that going
on 40+ years old?) "findstr" was incredibly useful. I just looked through every file in our
repository to find the old string "Statistics and Calculations" that
I need to edit.
Now I had a list of
all the files in a weird DOS syntax.
Example:
integration_tests\legacytest\main\db\RegexpMatchFunctionTest.cpp: CPPUNIT_TEST_SUITE_EX(
RegexpMatchFunctionRequiredUnitTest, PRIMARY_TEAM(
STATISTICS_AND_CALCULATIONS_TEAM ), SECONDARY_TEAM( VIZQL_TEAM ) );
Also notice that the
path is incomplete - it just starts with the \integration_tests folder and goes
from there.
The actual list of
files is well over a hundred and my next task was to clean up this list. I though about hand editing the file using
Find and Replace and manually cutting out stuff I did not need, but that would
have taken me well over an hour or two.
Plus, if I missed a file, I would have to potentially start over, or at
least figure out how to restart the process with changes. Instead, I decided to write a little python
utility to read through the file, find the (partial) path and filename and
remove everything else in each line.
Then correct the path and add the command I need to actually make the
file editable. Our team uses perforce so
this was just adding "p4 edit " to the start of each file. And fixing the path was pretty simple - just
prepend the folder name I was in when I ran findstr.
Finally, clean out
duplicate file names and run my code. It
created a 13K batch file ready for me to get to work, and if I need to update,
I can just run my code again. Kind of
like reproducible research
- at least that is how I think of it.
I can post the code
if anyone is interested, but it is
pretty basic stuff.
Questions, comments,
concerns and criticisms always welcome,
John
Monday, November 14, 2016
Obligatory Tableau Conference follow up
Tableau Conference 16 (TC16 as we call it) was
successfully held last week in Austin, Texas.
Hundreds of talks and trainings, keynotes from Bill Nye and Shankar
Vedantam, a look ahead into our plans and thousands of customers made for a very busy week. I was there working from Saturday to Thursday
and it seems like the time just flew by.
For what it is worth, I took a hiatus from technical work and kept the
logo store stocked as well as I could.
While I was able to meet many, many customers in the store, I did not
have the time to talk much about Tableau and their usage. The conference is both a blur and fresh in my mind, if such things are possible, and this is a quick summary of what I remember. I wanted to focus on users while I was there, so that is what is on my mind today.
On the way home,
though, a buddy and I met a couple of Tableau users in the airport. We started talking about their usage and I
asked them if we could do one thing for them, what would it be. One answer was "add more edit commands
to the web UI." Fair enough. The other was to help with the classification
(or bucketing) of many levels of hierarchical data. They classify educational institutions
broadly - I have in my mind "Liberal Arts School",
"Engineering", "Fine Arts" and so on. Then, they classify each school further into
many different levels and they need a tool to help with that. I also imagine this visually as sort of like
a process flow diagram, but that may be off base.
If you attended,
feel free to let me know what you thought of the conference. And if you did not, I would encourage you to
go next year. Biased though I may be, I
thought it was informative and fascinating.
The videos from the
sessions are available to attendees here: http://tclive.tableau.com/SignUp if
you missed anything (and I missed a whole lot!)
Questions, comments,
concerns and criticisms always welcome,
John
Monday, October 31, 2016
Gearing up for Tableau Conference and getting ready to meet our customers
The Tableau Conference will be held next week
in Austin, Texas. First, yay Texas! Second, this should be a great chance to meet
our customers. I have long advocated
that everyone involved in the software industry should spend time talking with
users of our software. I started in tech
support way back in the Windows 95 days and the lessons I learned there have
been incredibly useful over the years.
For instance, it is
easy to dismiss some unusual behavior in software by saying, "Well, that
is an extremely rare case and the people that see that will understand what is
happening." I heard this comment once about users that were trying to use
a utility that claimed to compress your memory on Windows 95 and cause your
computer to run faster. This was not the
case. The company that made this utility
claimed Win95 compatibility but the application simply did not work. It crashed on boot and caused an ugly error
when Windows started. Many users that
bought it did not know what to do and called Windows technical support instead
(at which point we showed them how to disable the utility and contact the
company that wrote it for support). The
lesson I learned there is that many users are savvy enough to know they want a
faster machine and tend to believe companies that say they can deliver. If they have problems, though, they get stuck
and cannot fix the errors. I liken this
to cars - we want high mileage cars, but if a gizmo we buy does not work right,
many of us have to turn to a mechanic for help.
And that is the
lesson I learned, or re-learned: an ounce of prevention is worth a pound of
cure. If we can simplify the design so
that potential errors are minimized, fewer people will have to contact support
(or take their car to a mechanic, if you are following that analogy) for
help. And that benefits everyone.
I use that mentality
early in the planning stages for features.
If we can push to simplify the design, or minimize the number of buttons
to click, or eliminate even one dialog, the feature will be more resilient to errors
created by clicking the wrong button or dismissing a dialog to early or even something like another application
stealing focus while a dialog is open.
Feel free to let me know what you think of the Tableau interface for
creating clusters, and I hope to see you next week at TC. I will be in the logo wear booth for most of
my time, so we should have plenty of time to talk!
Questions, comments,
concerns and criticisms always welcome,
John
Monday, October 24, 2016
Automation fixes and generating test data
My automation
changes are checked in and working fine, but I am putting this on hold right
now as our team is working on a tool to generate test data for the future.
What we need is a
tool to create CSV files with good test data, and the most obvious first step
is to define "good" and "test" as they apply to data. Let's talk about forecasting first. We need time based data in order to test
forecast. There are a few statistical
methods we could use for generating the data and I want to cover 2 of them
here.
First is simply
random. Create a tool to generate random
times and some random value to go with
it. Think something like:
|
Time
|
Value
|
|
Jan 1, 2016,
12:02:53 AM
|
-126.3
|
|
July 8, 88,
2:19:21 PM
|
.000062
|
And so on. This creates data sets that have little real
world meaning (88 AD? .00062?) but might
be good test cases. I like the way the Value
column can have any number at any scale - that can really push an algorithm to
its limits. Think going from an atomic
scale for length to a galactic scale for length - the precision of the
algorithm will get stretched past a poorly designed breaking point for sure,
and probably to the limit of a well designed breaking point. And one of the roles of test is to verify
that the breaking point (well covered in my first few posts on this blog), when
hit, is handled gracefully. Oh, and we
document this as well.
The time column is a
little more cumbersome. Going back past
1582 gets dicey and right now Tableau only supports Gregorian calendars. Also, date formats can lead to their own unique
set of test cases that an application has to handle and most applications have
a whole team to handle this area. Notice
also that I did not include time zones - that facet alone has contributed to
the end of application development
in some cases.
We might be tempted
to have a rule about the lowest and highest values we have for the date/time of
the Time column, but we need to test for extreme values as well. But having a "bogus" value, for instance, a year of 12,322 AD, would give
us a good starting point for working on a potential code fix compared to
documenting these extreme values. Random
cases can be good tests, but can also be noisy and point out the same known
limitations over and over again. In some
cases, we want to avoid that and focus on more realistic data so that we can
validate the code works correctly in non-extreme cases.
A second method for
the time series that would help here would be to follow a time based generating
process like Poisson
. Basically, this can be used to
generate sample data for events that are based on the length of time between
events, such as customers coming into a store.
|
Time
|
Number of
Customers
|
|
10:00AM
|
5
|
|
10:10
|
7
|
|
10:20
|
11
|
|
10:30
|
24
|
|
10:40
|
16
|
Etc…
So our tool will
have to fulfill both these needs as well as any others we may discover as we
move forward. Once we have a good
starting set of needs, we can start designing the tool.
Questions, comments,
concerns and criticisms always welcome,
John
Monday, October 17, 2016
Adding to the order tests - making the edits a parameter
This week I have a
new test checked in - it simply deletes pills from the cluster dialog and
validates that the particular piece of data I removed is no longer used by the
k means algorithm. It checks that the
number of clusters is the same after the removal.
And on that point I
am very glad we have a deterministic algorithm.
When I wrote a kmeans classifier for an online class, we
randomly determined starting points, and that led to the possibility of
differing results when the code finished running. Deterministic behavior makes validation much
easier, and the user experience is also easier to understand.
So I added a test to
delete a pill. Not much to it, but now I
and add, remove and reorder each pill in the list. From here, I can use this as a parameter for
other tests. I can write a test to
validate the clusters are computed correctly when a data source is refreshed,
then combine that test with the "parameterized pill order" tests I
have already written. This gets me
integration testing - testing how two or more features interact with each
other. That is often hard, and there can
be holes in coverage. You see this with
a lot of reported bugs - "When I play an ogg vobis file in my firefox
addin while Flash is loading on a separate tab…" Those tests can get very involved and each
setting like the music player, firefox tabs, flash loading and so on can have
many different permutations to test.
The lesson here is
to start small. Find one parameter that
can be automated and automate it. Then
use it to tie into other parameters. That
is the goal here and I will keep you updated.
Questions, comments,
concerns and criticisms always welcome,
John
Monday, October 10, 2016
More automation
Last week I left off
with a test that mimics the user action of re-ordering the criteria you used to
create clusters. The clusters themselves
should not change when this happens, and the test verifies that they do not
change. I got that failure fixed and it
passed 10 times when I ran my test locally.
Why 10 times? I have learned that any test which
manipulates the UI can be flaky.
Although my test avoids the UI here as much as I can, it still has
elements drawn on screen and might have intermittent delays while the OS draws
something, or some random window pops up and steals focus, etc… So I run my test many times in an attempt to
root out sources of instability like these.
I would love to do
more than 10 tests but the challenge becomes the time involved in running one
of these end to end scenarios. There is
a lot of work for the computer to do to run this test. The test framework has to be started (I'm
assuming everything is installed already, but that is not always the case),
Tableau has to be started, a workbook loaded, etc… Then once done, cleanup needs to run, the OS
needs to verify Tableau has actually exited, all logs monitored for failures
and so on. It's not unusual for tests
like this to take several minutes and for sake of argument, let's call it 10
minutes.
Running my test 10
times on my local machine means 100 minutes of running - just over an hour and
a half. That is a lot of time. Running 100 times would mean almost 17 hours
of running. This is actually doable -
just kick off the 100x run before leaving to go home and it should be done the
next morning.
Running more than
that would be ideal. When I say these
tests can be flaky, a 0.1% failure rate is what I am thinking. In theory, a 1000x run would catch this. But that now takes almost a week of run
time. There are some things we can do to
help out here like run in virtual machines and such, but there is also a point
of diminishing returns.
Plus, consider the
random window popping open that steals focus and can cause my test to
fail. This doesn't have anything to do
with clsutering - that works fine, and my test can verify that. This is a broader problem that affects all
tests .There are a couple of things we can do about that which I will cover
next.
Questions, comments, concerns and criticisms always welcome,
John
Monday, October 3, 2016
Working on automation
Time for some
practical applications of testing. We
have many different types of tests that we run on each build
of Tableau. These range from the "industry
standard" unit tests, to integration tests, performance tests, end to
end
scenario tests and many more in between.
This week I am
working on end to end tests for our clustering algorithm. I have a basic set of tests already done
and
want to extend that to check for regressions in the future. We have a framework here built in Python that
we use to either drive the UI (only if absolutely needed) to invoke actions
direction in Tableau. I'm using that to
add tests to manipulate the pills in the Edit Cluster dialog:
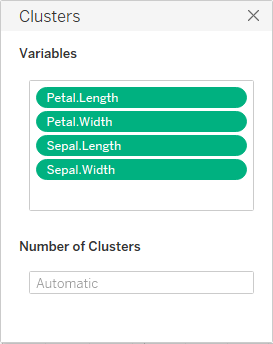
In case it is not
obvious, I am using the iris data set.
It is a pretty basic set of flower data that we used to test
kmeans as
we worked on implementing the algorithm.
You can get it here. I'm actually only using a subset of it
since
I really want to focus only on the test cases for this dialog and not so much
on the underlying algorithm. I
don't
need the whole set - just enough flowers that I detect a difference in the
final output once I manipulate
the pills in the dialog.
Some basic test
cases for the dialog include:
- Deleting a pill from the list
- Adding a pill to the list
- Reordering the list
- Duplicating a pill in the list (sort of like #2 but is treated separately)
- Replacing a pill on the list (you can drop a pill on top of an existing pill to replace it.
I'll leave the
number of clusters alone. That is better
covered by unit tests.
I'll let you know
how it goes. I should be done within a
day or so, other interrupting work notwithstanding.
Questions, comments,
concerns and criticisms always welcome,
John
Wednesday, September 28, 2016
Anscombe's Quartet is not especially good for software testing
In statistical
circles, there is a set of data known as Anscombe's Quartet. The link goes to Robert
Kosara's blog and he
does a good job of showing off the data set and how radically different
looking
data can have similar statistical properties.
The design of the
set of data was to give a column of data points that all have the same standard
deviation (as one example). For
instance, the standard deviation of the first Y column is 1.937024.
But the second Y column is 1.937109. In both cases, I am rounding the numbers to
the 6th
decimal place.
The difference in
the values is1.937109 - 1.937024=
0.000085. Now, this is very close and to
a
human eye trying to view a plot of the data is probably too small to be
seen. For making a point
about the data -
that similar statistical properties cannot be used to determine the shape of
a
data set - this is good enough. But
computers have enough precision that a difference of
0.000085 is large enough to be detected and
the 2 columns of data would be distinctly
differentiable.
As a side note, I
did test clustering with the data set just for fun. Folks around here kind of grinned
a bit since
this data set is pretty well known and thought it would be fun to see the
results.
But as a test case, it really
is not very good at all. The challenge
here would be to come up with 2
columns of data that had the exact same standard deviation (subject to rounding errors) and use
that to validate tie
breaking rules we might have for this condition. One easy way to do this would
be to reverse
the signs of the numbers from column 1 when creating column 2. Then make a quick
check that the standard
deviation is the same to validate the rounding was the same for both
positive
and negative value calculations.
Another way would be
to scale the data, but that can result in different rounding behavior.
Even though this
data set is not a good test case, the idea behind it is very valid. Ensure that you
test with values that are
exactly the same - and keep in mind that you need to validate "exactly the
same" with any given data set.
Since this is such a
well known data set, I wanted to share my thoughts on it and why it is not all
that
useful for testing computer software. The precision of the computer needs to be taken into account.
Questions, comments,
concerns and criticisms always welcome,
John
Monday, September 19, 2016
A need for specific test cases
One of the tests we
have to complete is validating our implementations for accuracy. As I have mentioned, this can be tricky
simply because we are using computers and have to contend to with rounding
errors. Another reason this is hard is
simply the nature of statistics.
Consider the
meteorologist. Given a set of weather
statistics - temperature, barometric pressure, wind speed, etc… - the
meteorologist can state "There is a 70% chance of rain tomorrow."
Tomorrow comes, and
it rains. Was the forecast correct? Of course - there was a 70% chance of
rain. Now suppose tomorrow arrives, and
it does NOT rain. Again, was the
forecast correct? Of course - there was
a 30% chance that it would not rain.
Such is the nature of statistics, and that also hits us for some of our
work.
Recently, we added a
Clustering
algorithm to Tableau. The basic idea can
be viewed as "Given a set of data points like this, divide them into equal
size groups:"

In this case, I
tried to obviously draw three clusters, with about the same number of dots in
each.
But what about this
case:

Same number of
dots. Most people would probably want 2
groups, but that would probably look like this:

The group on the
right would have more dots, but visually this seems to make sense. Using three groups would give this:

Now they all have
the same number of dots, but the groups on the right are very close together.
The bigger question
to answer, just like the meteorologist faces, is "What is
correct?" And when predicting
situations like this, that is a very difficult question to answer. One of the challenges for the test team is
creating data sets like the dots above that can let us validate our algorithm
in cases which may not be as straightforward as some others. In the test world, these are "boundary
cases," and getting this data for our clustering testing was a task we
faced.
Questions, comments,
concerns and criticisms always welcome,
John
Monday, September 12, 2016
Software Testing is not insurance. It is defensive driving
Let's take a break
from diving into rounding errors and take a larger scoped view of the testing
role. After all, computing a basic
statistic - such as the average - of a set of numbers is a well understood
problem in the statistical world. How
much value can testers add to this operation?
Fair question. Let me try to
answer it with an analogy.
I used to repeat the
mantra I heard from many engineers in the software world that "testing is
insurance." This lead to the
question ," How much insurance do you want or need for your project?"
and that lead to discussions about the relative amount of funding a test
organization should have. The logic was
that if your project as a million dollar project, you would want to devote some
percentage of that million into testing as insurance that the project would
succeed.
The first analogy I
want to draw is that insurance is a not a guarantee - or even influencer - of
success. Just because I have car
insurance does not mean I won't get into a wreck. Likewise, buying vacation insurance does not
guarantee the weather will allow my flight to travel to the destination. Insurance only helps when things go
wrong. The software engineering world
has a process for that circumstance called "Root Cause
Analysis." I'll go over that later,
but for now, think of it as the inspection team looking at the wreck trying to
figure out what happened to cause the crash.
That leads me to my
second analogy: Testing is like
defensive driving. Defensive driving
does not prevent the possibility of a crash.
Instead, it lessens the chance that you will get into an accident. Hard stats are difficult to find, but most
insurance companies in the USA will give you a 10% reduction in your premiums
if you take such a class. Other estimate
range to up to a 50% decrease in the likelihood of a wreck, so I will use any
number you want between 10% and 50%.
How those results
are achieved are by teaching drivers to focus on the entire transportation
system around them. It is pretty easy to
get locked into only looking in one direction and then being surprised by
events that happen in another are (see where this analogy is going?). If I am concentrating on the road directly in
front of me, I may not notice a group of high speed drivers coming up behind me
until it is they are very close.
Likewise, if I am only concentrated on accurate computing an average, I
may not notice that my code is not performant and may not work on a server that
is in use by many people. In both cases,
having a wider view will make my driving - or code development - much smoother.
More on this coming
up.
Questions, comments, concerns and criticisms always welcome,
John
Thursday, September 8, 2016
My simple epsilon guideline
The general rule I want to follow for validation is that for big numbers, a
big epsilon is OK. For small numbers,
small epsilon is desirable.In other words, if we are looking at interstellar distances, and error of a few kilometers is probably acceptable, but for microscopic measuresments, a few micrometers may be more appropriate.
So my rule - open to
any interpretation - is "8 bits past the most precise point in the test
data." Let's look at a case where
we want a small epsilon - for example, we are dealing with precise decimal values.
Suppose we have
these data points for out test case:
1.1
2.7
8.003
The most precise
data point is that last one - 8.003. The
epsilon factor will be based off that.
8 bits of precision
means 1 / (2^8) or 1/256, which is approximately 1/256=0.0039. Let's call that .004. Append this to the precision of the last
digit of 8.003, which is the one thousandth place. I get 0.000004. This means anything that is within .000004 of
the exact answer will be considered correct.
So if we need to
average those three numbers:
1.1 + 2.7 + 8.003 =
11.803
11.803/3=3.9343
33333….
The exact answer for
the average is impossible to compute accurately in this case. I still need to verify we get close to the
answer, so my routine to validate the result will look for the average to be in
this range:
3.934333 - 0.000004
= 3.934329
3.934333 + 0.000004
= 3.934337
So if the average we
compute is between 3.934329 and 3.934337 .
More on this, and
how it can be implemented to enforce even greater accuracy will come up later.
Questions, comments,
concerns and criticisms always welcome,
John
Monday, August 29, 2016
What we can do, part 2
I've (hopefully)
laid out the challenge the test team has with validating models (algorithms)
given the constraints of using computers to compute results. There seem to be some large hurdles to jump
and indeed, there are.
On one hand, we
could just point to the documentation (IEEE-754)
and say "Well, you get the best computers can do." That only goes so far, though. The test team still needs to validate the
algorithm returns a value that is approximately
correct, so we have to define approximately.
Step 1 is to define
a range of values that we expect from an algorithm, rather than a single
value. This is a large step away from
"typical" software validation.
For instance, if I
send one piece of email with a subject "Lunar position" then I expect
to receive one piece of email with the subject "Lunar position". This is very straightforward and the basis
for most test automation. I expect
(exactly) 1 piece of email, the subject needs to be (exactly) "Lunar
position" and not "LUNAR POSITION" and the sender name need to
be (exactly) the account from which the test email was sent.
What we do on our validations is set an error factor which we call
epsilon: . This
error factor is added to the exact value a pure math algorithm would produce
and subtracted from that number as well to give a range of values we expect. To go back to the average example, we expect
a value of exactly 50. If we set the
epsilon to .0001, then we will allow the computer to pass the test if it gives
us a number between 50 - .0001 and 50 + .0001.
50 - =
49.9999 
50 + =
50.0001
The range of values
we would allow to pass would be between 49.9999 and 50.0001. Anything outside
of this range would fail.
If the output from a
test is 49.99997, we pass the test. If
50.03 is the result, we would fail the test.
This is pretty
simple, with the key challenge being setting a reasonable epsilon. I'll cover that in the future.
Questions, comments,
concerns and criticisms always welcome,
John
Thursday, August 25, 2016
So what can we do about this?
Here is the
challenge the test team has. Given that
even a simple algorithm can have unexpected results, and given that a computer
cannot - by its nature - give exact results, how can we validate the output of
a given model?
The answer is both
simple and difficult.
On the simple side,
we do exactly what you would expect.
Knowing that an expected output value should be (exactly) 50, we can set
up an error factor of some small amount and validate the value of the output is
within that range of the expected output.
In other words, we
can set a value of error equal to .00001, for instance. Then if the output of the algorithm is within
.00001 of 50, we can log a PASS result for the test. If it is more or less than that range (50 +/-
.00001) then we log a failure and investigate what happened.
That's the simple
part. In fact, having a small error
factor is pretty standard practice. If
you want to read a bit more about this, just look up how computers determine
the square root of a number. This
technique is usually taught during the first week or so of a computer science
course. (And then it is hardly mentioned again, since it is such a rabbit hole. Then it becomes a real consideration in jobs
like this one).
The hard part is
knowing how to set a reasonable range.
Obviously, a very large range will allow bogus results to be treated as
passing results. If we are trying to
compute the average of 1-99 and allow a "correct" answer to be +/- 10
from from 50 (45 to 55), the test will always pass. But everyone will notice that 54 or 47 or
whatever else is not correct.
And if we make it
too small - like .0000000000000001 (that is a 1 at the 16th decimal place),
then the test will likely fail as we change the range to compute due to
expected rounding errors.
This is a large
challenge for us and I'll outline what we do to handle this next.
Questions, comments, concerns and criticisms always welcome,
John
Monday, August 22, 2016
How much precision an we provide?
So there are some
big challenges right out of the gate when testing statistical software, and so
far I've looked at rounding errors. The
bigger question, given that computers have this innate limitation, is how accurate
can and should we be?
On one hand,
statistics gives probabilities, not truth.
So having a routine give a 86.4532%
chance compared to second routine giving an 86.4533% seems like we are splitting hairs. But we have some trust in
our computers and we need to get the answer as "right" as possible.
My favorite stat on
this is Nasa using 15
digits of accuracy for pi. That is
as much as they need to track everything they have ever launched, so that is
one benchmark to consider. For the
software on which I work, I doubt many folks are tracking interstellar traffic,
though. It's still a good data point.
Financial markets
are something we handle. This gets
tricky really quickly, though. In the
USA, we track (pennies) to two decimal places and have rules about rounding the
third decimal place. Other countries use
more decimal places, so this doesn't help much.
(Side note: Ohio has a rounding methodology for sales tax that strongly
skews to higher taxes: http://www.tax.ohio.gov/sales_and_use/information_releases/st200505.aspx)
There is also a
performance (of the computer) vs. precision factor that we need to
consider. While we could get much more
precision, that comes at the cost of run time.
One way of having more precision would be to allocate more memory for
each number we are using. Also, there
are some libraries that the National Institute of Standards and Technology
makes available that really help, and companies like Intel also provide these
tools. They generally run more slowly
than code that doesn't push for that level of precision. More on this later.
Looking ahead, once
we settle on a standard, then the test team has to ensure we meet that goal
100% of the time. I'll finally get
around to covering that aspect of the test team's goals as we go along.
Questions, comments,
concerns and criticisms always welcome,
John
Friday, August 19, 2016
Some background for understanding testing the models
I received a comment
from a reader last week (I have readers?
Wow. I did very little
"advertising"). Anyway, this
person was a bit confused about modeling averages. I can understand that - we all learn how to
compute averages in junior high or so, and unless we took an advanced math
class, we never were exposed to why the algorithm works or whether there are
alternatives to the way we learned (add 'em all up and divide by the number of
things you added).
I figured a little
background reading might help. Nothing
too deep - I want to keep this blog away from research math and more accessible
to everyone.
Averages are taken
for granted nowadays but that has certainly not been the case always. In fact, in some ways, they were
controversial when first introduced. And
even "when they were first introduced" is a tough question to
answer. http://www.york.ac.uk/depts/maths/histstat/eisenhart.pdf
is a good starting point for digging into that aspect of averages.
The controversial
part is pretty easy to understand and we even joke about it a bit today. "How many children on average does a
family have?" is the standard question which leads to answers like 2.5. Obviously, there are no "half kids"
running around anywhere, and we tend to laugh off these silly results. Coincidentally, the US believes the ideal
number of kids is 2.9. The
controversy came in initially - what value is an average if there is no actual,
real world instance of a result having this value? In other words, what use would it to be to
know that the average family has 2.5 children, yet no families have 2.5
children?
The controversy here
was directed at the people that computed averages. They came up with a number - 2.5 in this
example - that is impossible to have in the real world. And if you try to tell me your algorithm is a
good algorithm yet it gives me impossible results, then I have to doubt it is
"good."
(We will come back
to the standard phrase "All models are wrong. Some are useful." later).
Floating point math
is a more difficult concept to cover.
I don't want to get
into the details of why this is happening in this blog since there is a huge
amount of writing on this already. If
you want details I found a couple of good starting points.
A reasonable
introduction to this is on wikipedia:
A more hands on,
technical overview:
Questions, comments,
concerns and criticisms always welcome,
John
Monday, August 15, 2016
Problems with the models
So now we have 2
models that we can use to compute an average.
Both are mathematically correct and we expect to avoid some large
numbers with our second model (the model in which we divide each number first
by the count of all the numbers). This
requires a suspension of disbelief because our maximum number we can handle is
4 billion and I know the testers out there have already asked, "But what
if the average is expected to be over 4 billion?" We'll come back to that after we test the
basic cases for the second model.
Let's start with
some Python code here. Nothing special
for the first model we had in which we add all the numbers first and divide by the
count of the numbers:
sum = 0 #this is the running total
k=0 #this is how
many items there are total
for i in
range(1,100): #this will go from 1 to
100.
sum += i # add each number to the total,
1+2+3+4+5 ….+99
k+=1 #count how many numbers there are -
there are 99 because python skips the 100 from above
print(sum / k) # print the average
And when this is run
Python prints out 50.0. This is what we
expected (except maybe we only expected 50 without the "point 0" at the end).
If we keep the k we
had above (99) then we can add a second bit of code to get the second model
working. Remember, the second model is the one in which we divide each number by the count of all the numbers there are and then add to a running total. That running total will be the average value when done.
sum = 0 #reset the sum to zero
for i in
range(1,100): #again, loop from 1 to 99
sum += i/k
#now add 1/99 + 2/99 + 3/99 + 4/99 + 5/99 …. + 99/99
print(sum)
And we get an
incorrect result:
49.99999999999999
This is a short
example of floating point errors cropping up.
We haven't even gotten to the test to see if our numbers were getting
too large and we already need to deal with this.
Questions, comments, concerns and criticisms always welcome,
John
Subscribe to:
Posts (Atom)