Monday, October 17, 2016

Adding to the order tests - making the edits a parameter


This week I have a 
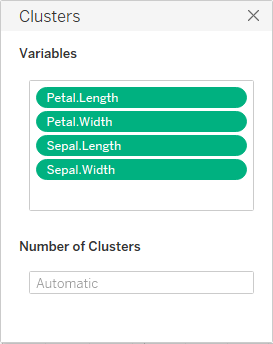
new test checked in - it simply deletes pills from the cluster dialog and validates that the particular piece of data I removed is no longer used by the k means algorithm.  It checks that the number of clusters is the same after the removal.

And on that point I am very glad we have a deterministic algorithm.  When I wrote a kmeans classifier for an online class, we randomly determined starting points, and that led to the possibility of differing results when the code finished running.  Deterministic behavior makes validation much easier, and the user experience is also easier to understand.

So I added a test to delete a pill.  Not much to it, but now I and add, remove and reorder each pill in the list.  From here, I can use this as a parameter for other tests.  I can write a test to validate the clusters are computed correctly when a data source is refreshed, then combine that test with the "parameterized pill order" tests I have already written.  This gets me integration testing - testing how two or more features interact with each other.  That is often hard, and there can be holes in coverage.  You see this with a lot of reported bugs - "When I play an ogg vobis file in my firefox addin while Flash is loading on a separate tab…"  Those tests can get very involved and each setting like the music player, firefox tabs, flash loading and so on can have many different permutations to test.

The lesson here is to start small.  Find one parameter that can be automated and automate it.  Then use it to tie into other parameters.  That is the goal here and I will keep you updated.

Questions, comments, concerns and criticisms always welcome,
John

Monday, October 10, 2016

More automation


Last week I left off with a test that mimics the user action of re-ordering the criteria you used to create clusters.  The clusters themselves should not change when this happens, and the test verifies that they do not change.  I got that failure fixed and it passed 10 times when I ran my test locally.

Why 10 times?  I have learned that any test which manipulates the UI can be flaky.  Although my test avoids the UI here as much as I can, it still has elements drawn on screen and might have intermittent delays while the OS draws something, or some random window pops up and steals focus, etc…  So I run my test many times in an attempt to root out sources of instability like these.

I would love to do more than 10 tests but the challenge becomes the time involved in running one of these end to end scenarios.  There is a lot of work for the computer to do to run this test.  The test framework has to be started (I'm assuming everything is installed already, but that is not always the case), Tableau has to be started, a workbook loaded, etc…  Then once done, cleanup needs to run, the OS needs to verify Tableau has actually exited, all logs monitored for failures and so on.  It's not unusual for tests like this to take several minutes and for sake of argument, let's call it 10 minutes.

Running my test 10 times on my local machine means 100 minutes of running - just over an hour and a half.  That is a lot of time.  Running 100 times would mean almost 17 hours of running.  This is actually doable - just kick off the 100x run before leaving to go home and it should be done the next morning. 

Running more than that would be ideal.  When I say these tests can be flaky, a 0.1% failure rate is what I am thinking.  In theory, a 1000x run would catch this.  But that now takes almost a week of run time.  There are some things we can do to help out here like run in virtual machines and such, but there is also a point of diminishing returns.

Plus, consider the random window popping open that steals focus and can cause my test to fail.  This doesn't have anything to do with clsutering - that works fine, and my test can verify that.  This is a broader problem that affects all tests .There are a couple of things we can do about that which I will cover next.

Questions, comments, concerns and criticisms always welcome,
John

Monday, October 3, 2016

Working on automation


Time for some practical applications of testing.  We have many different types of tests that we run on each build
 of Tableau.  These range from the "industry standard" unit tests, to integration tests, performance tests, end to
end scenario tests and many more in between.

This week I am working on end to end tests for our clustering algorithm.  I have a basic set of tests already done 
and want to extend that to check for regressions in the future.  We have a framework here built in Python that 
we use to either drive the UI (only if absolutely needed) to invoke actions direction in Tableau.  I'm using that to
add tests to manipulate the pills in the Edit Cluster dialog:


In case it is not obvious, I am using the iris data set.  It is a pretty basic set of flower data that we used to test 
kmeans as we worked on implementing the algorithm.  You can get it here.  I'm actually only using a subset of it 
since I really want to focus only on the test cases for this dialog and not so much on the underlying algorithm. 
don't need the whole set - just enough flowers that I detect a difference in the final output once I manipulate 
the pills in the dialog.

Some basic test cases for the dialog include:
  1. Deleting a pill from the list
  2. Adding a pill to the list
  3. Reordering the list
  4. Duplicating a pill in the list (sort of like #2 but is treated separately)
  5. Replacing a pill on the list (you can drop a pill on top of an existing pill to replace it.  
                       ( More on this case later).

I'll leave the number of clusters alone.  That is better covered by unit tests.

I'll let you know how it goes.  I should be done within a day or so, other interrupting work notwithstanding.

Questions, comments, concerns and criticisms always welcome,
John

Wednesday, September 28, 2016

Anscombe's Quartet is not especially good for software testing


In statistical circles, there is a set of data known as Anscombe's Quartet.  The link goes to Robert 
Kosara's blog and he does a good job of showing off the data set and how radically different 
looking data can have similar statistical properties.

The design of the set of data was to give a column of data points that all have the same standard 
deviation (as one example).  For instance, the standard deviation of the first Y column is 1.937024. 
But the second Y column is 1.937109.  In both cases, I am rounding the numbers to the 6th 
decimal place.

The difference in the values is1.937109 - 1.937024= 0.000085.  Now, this is very close and to a 
human eye trying to view a plot of the data is probably too small to be seen.  For making a point 
about the data - that similar statistical properties cannot be used to determine the shape of 
a data set - this is good enough.  But computers have enough precision that a difference of  
 0.000085 is large enough to be detected and the 2 columns of data would be distinctly 
differentiable.

As a side note, I did test clustering with the data set just for fun.  Folks around here kind of grinned 
a bit since this data set is pretty well known and thought it would be fun to see the results.   
But as a test case, it really is not very good at all.  The challenge here would be to come up with 2 
columns of data that had the exact same standard deviation (subject to rounding errors) and use 
that to validate tie breaking rules we might have for this condition.  One easy way to do this would 
be to reverse the signs of the numbers from column 1 when creating column 2.  Then make a quick 
check that the standard deviation is the same to validate the rounding was the same for both 
positive and negative value calculations. 

Another way would be to scale the data, but that can result in different rounding behavior.

Even though this data set is not a good test case, the idea behind it is very valid.  Ensure that you
 test with values that are exactly the same - and keep in mind that you need to validate "exactly the 
same" with any given data set.

Since this is such a well known data set, I wanted to share my thoughts on it and why it is not all that 
useful for testing computer software.  The precision of the computer needs to be taken into account.

Questions, comments, concerns and criticisms always welcome,
John

Monday, September 19, 2016

A need for specific test cases


One of the tests we have to complete is validating our implementations for accuracy.  As I have mentioned, this can be tricky simply because we are using computers and have to contend to with rounding errors.  Another reason this is hard is simply the nature of statistics.

Consider the meteorologist.  Given a set of weather statistics - temperature, barometric pressure, wind speed, etc… - the meteorologist can state "There is a 70% chance of rain tomorrow."

Tomorrow comes, and it rains.  Was the forecast correct?  Of course - there was a 70% chance of rain.  Now suppose tomorrow arrives, and it does NOT rain.  Again, was the forecast correct?  Of course - there was a 30% chance that it would not rain.  Such is the nature of statistics, and that also hits us for some of our work.

Recently, we added a Clustering algorithm to Tableau.  The basic idea can be viewed as "Given a set of data points like this, divide them into equal size groups:"


In this case, I tried to obviously draw three clusters, with about the same number of dots in each.  

But what about this case:


Same number of dots.  Most people would probably want 2 groups, but that would probably look like this:


The group on the right would have more dots, but visually this seems to make sense.  Using three groups would give this:


Now they all have the same number of dots, but the groups on the right are very close together.


The bigger question to answer, just like the meteorologist faces, is "What is correct?"  And when predicting situations like this, that is a very difficult question to answer.  One of the challenges for the test team is creating data sets like the dots above that can let us validate our algorithm in cases which may not be as straightforward as some others.  In the test world, these are "boundary cases," and getting this data for our clustering testing was a task we faced.

Questions, comments, concerns and criticisms always welcome,
John

Monday, September 12, 2016

Software Testing is not insurance. It is defensive driving


Let's take a break from diving into rounding errors and take a larger scoped view of the testing role.  After all, computing a basic statistic - such as the average - of a set of numbers is a well understood problem in the statistical world.  How much value can testers add to this operation?  Fair question.  Let me try to answer it with an analogy.

I used to repeat the mantra I heard from many engineers in the software world that "testing is insurance."  This lead to the question ," How much insurance do you want or need for your project?" and that lead to discussions about the relative amount of funding a test organization should have.  The logic was that if your project as a million dollar project, you would want to devote some percentage of that million into testing as insurance that the project would succeed. 

The first analogy I want to draw is that insurance is a not a guarantee - or even influencer - of success.  Just because I have car insurance does not mean I won't get into a wreck.  Likewise, buying vacation insurance does not guarantee the weather will allow my flight to travel to the destination.  Insurance only helps when things go wrong.  The software engineering world has a process for that circumstance called "Root Cause Analysis."  I'll go over that later, but for now, think of it as the inspection team looking at the wreck trying to figure out what happened to cause the crash.

That leads me to my second analogy:  Testing is like defensive driving.  Defensive driving does not prevent the possibility of a crash.  Instead, it lessens the chance that you will get into an accident.  Hard stats are difficult to find, but most insurance companies in the USA will give you a 10% reduction in your premiums if you take such a class.  Other estimate range to up to a 50% decrease in the likelihood of a wreck, so I will use any number you want between 10% and 50%.

How those results are achieved are by teaching drivers to focus on the entire transportation system around them.  It is pretty easy to get locked into only looking in one direction and then being surprised by events that happen in another are (see where this analogy is going?).  If I am concentrating on the road directly in front of me, I may not notice a group of high speed drivers coming up behind me until it is they are very close.  Likewise, if I am only concentrated on accurate computing an average, I may not notice that my code is not performant and may not work on a server that is in use by many people.  In both cases, having a wider view will make my driving - or code development - much smoother.

More on this coming up.

Questions, comments, concerns and criticisms always welcome,
John

Thursday, September 8, 2016

My simple epsilon guideline


The general rule I want to follow for validation is that for big numbers, a big epsilon is OK.  For small numbers, small epsilon is desirable.In other words, if we are looking at interstellar distances, and error of a few kilometers is probably acceptable, but for microscopic measuresments, a few micrometers may be more appropriate.

So my rule - open to any interpretation - is "8 bits past the most precise point in the test data."  Let's look at a case where we want a small epsilon - for example, we are dealing with precise decimal values.

Suppose we have these data points for out test case:
1.1
2.7
8.003

The most precise data point is that last one - 8.003.  The epsilon factor will be based off that.

8 bits of precision means 1 / (2^8) or 1/256, which is approximately 1/256=0.0039.  Let's call that .004.   Append this to the precision of the last digit of 8.003, which is the one thousandth place.  I get 0.000004.  This means anything that is within .000004 of the exact answer will be considered correct.

So if we need to average those three numbers:
1.1 + 2.7 + 8.003 = 11.803
11.803/3=3.9343 33333….

The exact answer for the average is impossible to compute accurately in this case.  I still need to verify we get close to the answer, so my routine to validate the result will look for the average to be in this range:
3.934333 - 0.000004 = 3.934329
3.934333 + 0.000004 = 3.934337

So if the average we compute is between  3.934329  and 3.934337 .

More on this, and how it can be implemented to enforce even greater accuracy will come up later.

Questions, comments, concerns and criticisms always welcome,
John